By the Limo Captain Editorial Team | June 2026 | 7-minute read | Category: Fleet Management & Business Performance | Limo Captain Blog
Key Takeaways
• Fleet utilization should sit between 60% and 70% during peak hours.
• Fuel costs represent about 24% of total operational costs for limo companies.
• A healthy net profit margin for a limo business is 10% to 20%.
• On-time performance should be 98% or higher in luxury transport.
• Labor typically accounts for 30% to 40% of total gross revenue.
• A healthy customer lifetime value to acquisition cost ratio is 3:1 or higher.
Why Limo Business Metrics Are the Foundation of Fleet Performance
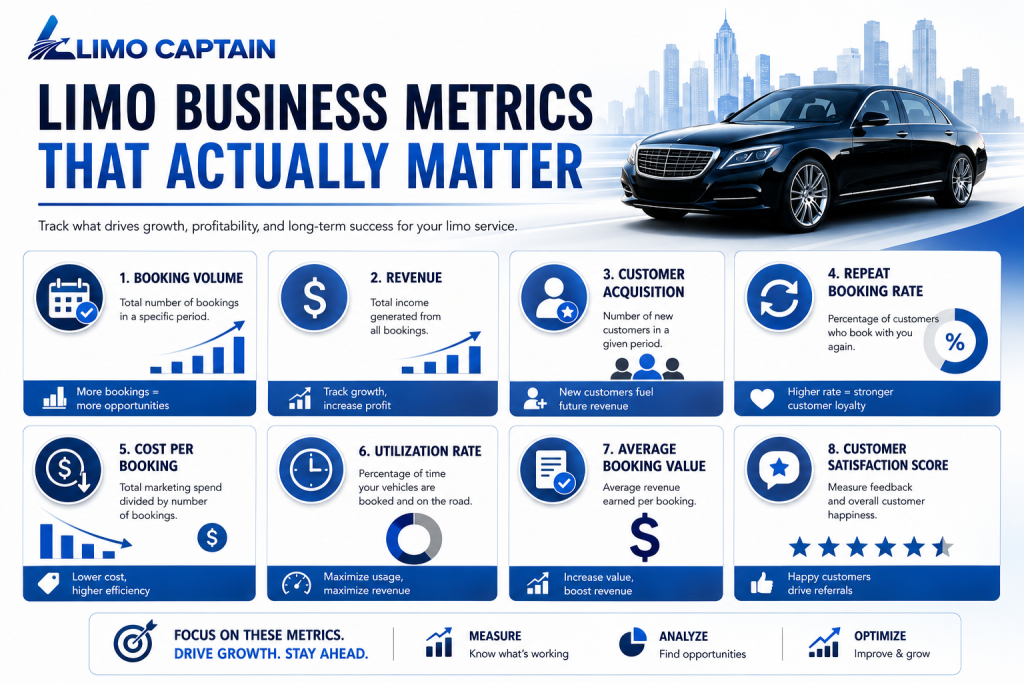
Limo business metrics are KPIs — key performance indicators. They show whether your fleet is profitable, drivers are productive, and clients are returning. Without them, you are running the business on instinct. With them, you make decisions based on real fleet data.
The limo industry in Canada is competitive. Average limousine service revenue sits at approximately $220,700 per year. Tracking the right metrics determines who captures that revenue — and who falls behind.
This guide covers the fleet KPIs that actually move the needle. Each section targets a different area of the business.
Fleet Utilization: Are Your Vehicles Working Hard Enough?
Fleet utilization is one of the most important fleet management KPIs. It measures the percentage of available hours that vehicles are actively booked. High utilization means efficient revenue generation. Low utilization points to idle assets draining operating costs.
Formula: Utilization Rate = (Hours Booked ÷ Total Available Hours) × 100 — use hours, not mileage, to match the 60-70% target
Target: Aim for 60% to 70% fleet utilization during peak operational times.
Monitoring asset utilization identifies underused vehicles. A vehicle sitting idle costs money in depreciation, insurance, and maintenance. Fleet managers who track this metric make smarter decisions about fleet size and scheduling.
High vehicle utilization lowers overall operating costs per unit. It also helps determine optimal vehicle replacement timing before vehicles become a liability.
Revenue Metrics: Tracking What the Business Actually Earns
Revenue Per Trip
Revenue Per Trip tracks average earnings per completed ride. It is the clearest measure of whether your pricing reflects your costs and market position.
Track this metric by vehicle type, service type, and time of day. It reveals which bookings are most profitable — and which are being underpriced.
Revenue Per Available Vehicle
Revenue Per Available Vehicle measures average income per vehicle. It connects utilization directly to revenue. High utilization with low revenue per trip signals a pricing issue. High revenue with low utilization signals a scheduling opportunity.
Profit Margin Per Trip
Profit Margin Per Trip calculates profitability on a per-ride basis after deducting all costs. This is the most granular revenue KPI available to fleet managers.
A healthy net profit margin for limousine companies is typically 10% to 20%. Tracking this per trip reveals which routes, services, and clients are actually profitable.
Fuel Efficiency KPIs: The 24% Problem
Fuel consumption makes up about 24% of total operational costs for limo companies. Fuel efficiency is one of the highest-impact areas fleet managers can optimize.
Tracking fuel usage trends is the first step. Without consistent fleet data on fuel spend, identifying patterns and reducing costs is impossible.
Cost Per Mile
Cost Per Mile tracks vehicle operating expenses per unit of distance. It is a core fleet management metric for measuring efficiency across different vehicles and routes.
A rising cost per mile signals idling, inefficient routes, or a vehicle nearing end of life. Fleet managers use it to plan trips, compare vehicles, and justify asset replacement.
Key insight: Excessive idling increases fuel consumption and costs. Monitoring harsh braking events and driver behavior can reduce both fuel expenses and vehicle wear.
Optimizing Routes to Reduce Fuel Spend
Optimizing routes can significantly lower overall fuel costs. Route planning reduces deadhead miles — distance driven without a passenger. Deadhead miles generate zero revenue but consume fuel and add vehicle wear.
Fuel efficiency KPIs help reduce empty miles. Fleet management software can surface the routes and patterns generating the most deadhead mileage. That data supports better trip planning and dispatch decisions.
Fleet Maintenance Metrics: Preventing Costly Surprises
Preventative Maintenance Compliance
Preventative maintenance compliance measures completed maintenance tasks against scheduled tasks. Low compliance means vehicles are running past their service intervals. This increases repair costs and the risk of unexpected vehicle downtime.
Fleet management software automates maintenance scheduling and record-keeping. This removes the administrative burden and ensures nothing is missed across the whole fleet.
Average Vehicle Downtime
Average vehicle downtime is calculated as total downtime divided by the number of incidents. High downtime affects customer trust and service fulfillment directly.
Monitoring average vehicle downtime reduces operational costs. A vehicle out of service is revenue not earned. Tracking repair turnover rate ensures quick servicing and limits schedule disruption.
Fleet Maintenance Downtime affects the business in two ways. It reduces fleet capacity in the short term. And it erodes customer satisfaction when trips cannot be fulfilled.
Total Cost of Ownership
Total Cost of Ownership (TCO) includes both fixed and variable vehicle costs. This includes purchase price, insurance, maintenance expenses, fuel spend, and depreciation.
Tracking vehicle cost per mile helps identify cost-effective operations across the fleet. Monitoring vehicle health helps identify optimal replacement windows before repair costs exceed the vehicle’s value.
Labor and Cost Metrics: Knowing Where the Money Goes
Labor costs typically account for 30% to 40% of total gross revenue in limousine services. This is the largest controllable cost in most limo operations.
Budget adherence is the metric that connects labor costs to business planning. Fleet managers should track driver hours, overtime, and productivity against planned budgets regularly. Variance from budget is an early warning signal.
Customer Acquisition Cost (CAC) is the total cost of sales and marketing per new client. A healthy LTV to CAC ratio is 3:1 or higher. A ratio below 3:1 means the business model needs attention.
Driver Behavior and Safety KPIs
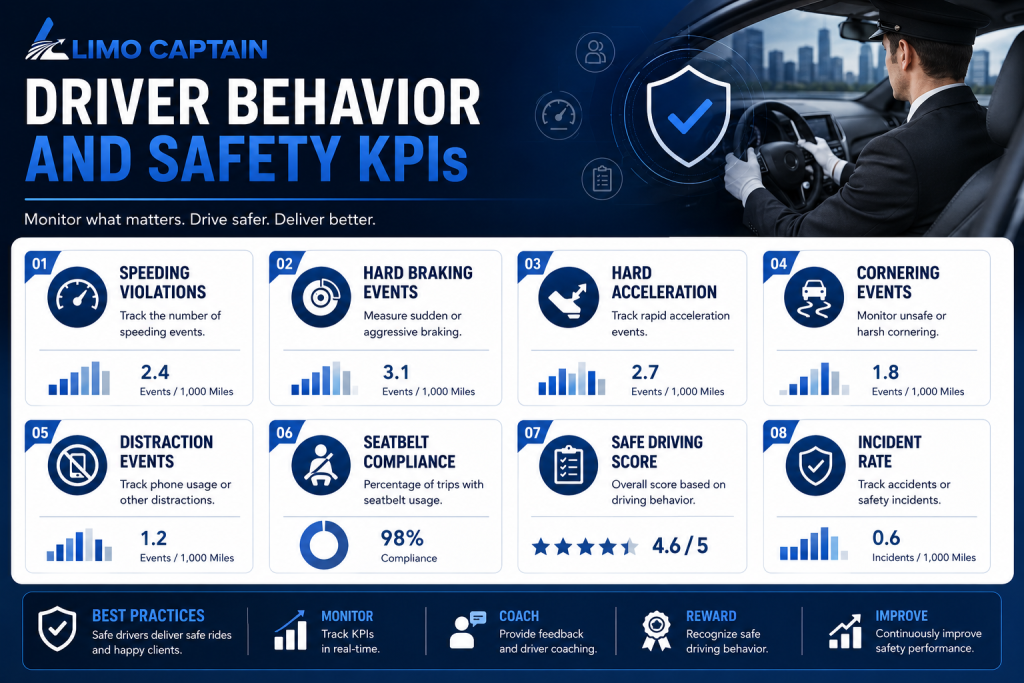
Driver behavior directly affects fuel efficiency, vehicle wear, and client satisfaction. Fleet managers who track driver behavior create a safer, more cost-effective operation.
On-Time Performance
On-Time Arrival Rate is the percentage of pickups where the chauffeur arrives on time. In luxury transport, this should ideally be 98% or higher. Anything below this damages client relationships and reduces repeat booking frequency.
Harsh Braking and Driving Habits
Monitoring harsh braking events helps improve driver behavior. Harsh braking increases vehicle wear and fuel consumption. It also raises safety incident risk across the fleet.
Safe driving habits reduce maintenance costs and extend vehicle life. Monitoring driver behavior reduces safety incidents and compliance violations. Telematics systems make this data available in real time — without requiring manual reports.
Daily Driver Vehicle Inspection Reports
Daily Driver Vehicle Inspection Reports (DVIRs) ensure vehicle safety compliance. Electronic DVIRs improve efficiency in tracking vehicle inspections. Regular inspections help maintain compliance with applicable transportation regulations.
Fleet managers should track safety incidents alongside DVIR completion rates. The two metrics together give a complete picture of fleet safety performance.
Customer Metrics: Retention Is Revenue
Customer Retention Rate
Customer Retention Rate measures the percentage of clients who rebook. High retention means consistent service value. Low retention signals a problem somewhere in the service chain.
Limousine companies should track customer retention and acquisition metrics together. Retention is almost always more cost-effective than acquisition. Repeat Booking Frequency tracks how often an account books within a set timeframe. Track it alongside retention.
Customer Lifetime Value
Customer Lifetime Value (LTV) estimates total net profit per customer over their relationship with the business. This is the metric that justifies investment in service quality, driver training, and customer communication.
Net Promoter Score measures the likelihood of customers recommending the service. It is a leading indicator of future retention and organic growth. Track it alongside LTV for a full picture of customer health.
Putting It Together: Your Fleet Management Dashboard
The most effective fleet managers do not track every metric. They track the right metrics for their current stage of growth.
A practical fleet management dashboard covers one metric from each category:
• Utilization — Fleet Utilization Rate (target: 60%–70%)
• Revenue — Revenue Per Trip and Profit Margin Per Trip
• Fuel — Cost Per Mile and fuel spend trends
• Maintenance — Preventative Maintenance Compliance and average downtime
• Labor — Budget Adherence and driver hours
• Driver — On-Time Arrival Rate and harsh braking events
• Customer — Retention Rate and Customer Lifetime Value
Review these metrics weekly for operational KPIs. Review financial and customer metrics monthly. Continuous improvement comes from consistent tracking — not one-time audits.
Frequently Asked Questions – Limo Business Metrics
What Are the Most Important Limo Business Metrics to Track?
Key limo business metrics include fleet utilization, revenue per trip, cost per mile, and on-time arrival. Customer retention completes the picture. These fleet KPIs cover profitability, operational efficiency, driver performance, and customer satisfaction. Together they give fleet managers a clear performance picture — without a complex analytics system.
What Is a Good Fleet Utilization Rate for a Limo Company?
A good fleet utilization rate for a limo company is 60% to 70% during peak periods. This indicates that the fleet is generating revenue efficiently without overextending vehicles or drivers. Fleet utilization is calculated as total mileage driven divided by total mileage capacity, multiplied by 100. Rates below 60% signal underused assets. Rates consistently above 70% may indicate a need to expand the fleet.
How Do Fleet Managers Reduce Fuel Costs in a Limo Business?
Fleet managers reduce fuel costs by optimizing routes, monitoring driver behavior, and tracking cost per mile. Each lever targets a different source of waste. Fuel consumption represents about 24% of total operational costs in the limo industry. Fleet data reveals fuel usage trends. Route efficiency strategies then reduce fuel expenses directly.
How Does Fleet Maintenance Tracking Improve Budget Adherence?
Fleet maintenance tracking improves budget adherence by replacing reactive repairs with scheduled maintenance. Preventative maintenance compliance measures completed tasks against scheduled ones. This reduces unexpected repair costs and vehicle downtime. Fleet management software automates scheduling, ensuring nothing falls through the cracks across the entire fleet.
What Driver Behavior Metrics Should Limo Companies Monitor?
Limo companies should monitor on-time arrival rate, harsh braking events, idle time, and DVIR completion. On-time performance should be 98% or higher in luxury transport. Monitoring driver behavior reduces fuel expenses, lowers vehicle wear, and decreases safety incidents. Telematics systems provide this fleet data in real time. Fleet managers use it to coach drivers and improve safety.
Limo Captain gives fleet managers a live dashboard covering utilization, revenue, driver performance, and maintenance. Track the metrics that actually move your business forward. Book a free demo. See how Limo Captain supports fleet management for limo companies across Canada. Call us: +1 888-545-8881